

Small Business Accounting Basics: Revenue, Costs & Profit Explained

"Don’t let accounting terms scare you. In this post we break down the three most important financial numbers—Revenue, Costs, and Profit—into bite‑size, real‑world examples. By the end, you’ll be able to pull up a spreadsheet, read your numbers, and decide what to do next."

Relax – accounting isn’t scary

Small business accounting basics don’t have to be intimidating.  Imagine walking into a coffee shop and seeing a sign that reads, “Coffee for $3.50. Milk for $0.25. Rent $200/month.” That’s the snapshot of a business’s health: what comes in, what goes out, and what’s left. For a small‑business owner, knowing exactly how to calculate and interpret those three figures—Revenue, Costs, and Profit—is the foundation of every smart decision you’ll make, from pricing to hiring to marketing spend.

This guide is designed for owners who have never used a spreadsheet before, who read high‑school math, and who just want a clear, step‑by‑step walk‑through that ends with a working profit sheet.

The Three Pillars of Small Business Accounting Basics

These three pillars are the core of small business accounting basics . . .

Revenue – The “Top‑Line”

small business accounting basics – revenue growth chart

Revenue is the total amount of money your business brings in from sales or services. It’s the headline of your income statement and the only number that matters if you’re just starting out. Think of it as the water you pour into your bucket.

Example: Your coffee shop sells 3,000 cups at $3.50 each.
Revenue = 3,000 × $3.50 = $10,500 for the month.
Costs – The “Bottom‑Line” That Eats Into Your Money

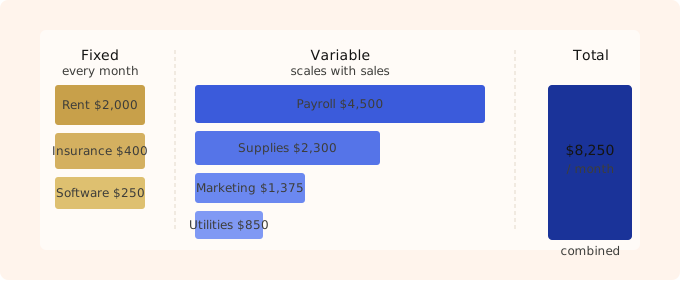
small business accounting basics – fixed and variable costs breakdown

Costs are everything that drains cash from your bucket. They fall into two buckets:

  • Fixed costs – those that stay the same every month (rent, insurance).
  • Variable costs – those that grow with sales (coffee beans, milk, electricity).

Example:
• Rent: $2,000
• Payroll: $4,500
• Coffee beans: $1,200
• Marketing: $300
• Utilities: $250
Total Costs = $8,250
Profit – The “What You Keep”

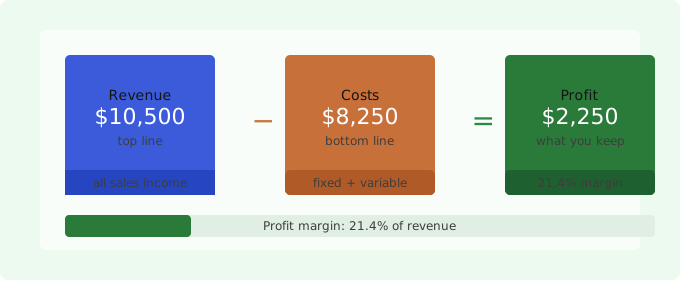
small business accounting basics – revenue minus costs equals profit

Profit is what remains after you subtract costs from revenue. It tells you whether you’re living off a wage (positive profit) or dipping into savings (negative profit).

Formula
Profit = Revenue – Costs
Example – $10,500 – $8,250 = $2,250

Profit also gives you a health check. A small margin (say, 5‑10%) might still be okay if you’re in a high‑volume, low‑cost industry, but a negative margin signals an urgent need to cut costs or raise revenue.

Turning Numbers Into Action: A One‑Page Profit Sheet

Why a One‑Page Sheet?

  • Clarity: All your numbers in one glance.
  • Speed: No need to flip through multiple reports.
  • Actionable: Spot trends and trigger decisions instantly.
  • Small business accounting basics doesn’t need an enterprise solution

Step‑by‑Step Construction

(or you can download the MS Excel version from here)

  1. Open Excel or Google Sheets and create a new file.
  2. Label the columns A–D as:
    A – Category
    B – Item
    C – Monthly Amount
    D – Notes
  3. Enter your revenue lines in rows 2–N:
    • A2: Revenue
    • B2: Coffee Sales
    • C2: 10,500
    • Repeat for Merchandise, Gift Cards, etc.
  4. Add a “Total Revenue” row (e.g., row 5) with the formula:
    =SUM(C2:C4)
    
  5. Repeat for costs:
    • A6: Costs
    • B6: Rent, Payroll, Supplies, Marketing, Utilities
    • Fill each C cell with the corresponding dollar amount.
    • Add a Total Costs row with the same SUM formula.
  6. Insert a Profit row (next row) with:
    =C5-C10
    
  7. Optional – Profit Margin: In a new column, calculate Profit/Total Revenue and format as a percentage.

Tip: In Google Sheets, copy the CSV block below into a blank sheet and the formulas will auto‑populate.

Category,Item,Monthly Amount,Notes
Revenue,Coffee Sales,12000,
Revenue,Merchandise,3000,
Revenue,Gift Cards,800,
Total Revenue,,,=SUM(C2:C4)
Costs,Rent,2000,
Costs,Payroll,4500,
Costs,Supplies,1200,
Costs,Marketing,300,
Costs,Utilities,250,
Total Costs,,,=SUM(C8:C12)
Profit,,,=C13-C14
Profit Margin,,,=C15/C13

Save this sheet as “Monthly Profit Sheet – .xlsx” and share it with any partners or bookkeepers.

What Do These Numbers Tell Me?

  • Profit > 0: You’re making money. Now ask: Can we increase profit?
  • Profit < 0: You’re operating at a loss. Identify the largest cost driver and consider renegotiation or cutting.
  • Profit Margin: A high margin (e.g., > 20%) usually means you’re pricing correctly and controlling costs. A low margin suggests you may need to increase prices or reduce variable expenses.

By comparing month‑to‑month or year‑to‑year, you can spot seasonal spikes, see the impact of a marketing push, or catch a sudden rise in supply costs before it erodes your bottom line.

FAQ

These are the most common small business accounting basics questions we hear:

What’s the difference between revenue and sales?

Revenue is the total dollar amount you receive; sales is the action of selling a product. Revenue = sales × price.

Do I need a CPA to calculate profit?

No. A simple spreadsheet with the formulas above suffices for most small businesses. |

What if my costs are higher than revenue?

You’re operating at a loss. Use the sheet to pinpoint the biggest cost drivers and cut or renegotiate them. |

Can I track these numbers weekly instead of monthly?

Yes. For highly volatile businesses, weekly tracking gives a more accurate pulse. |

Where do I find my cost data if I don’t use accounting software?

Collect receipts, bank statements, and invoices; categorize them in your sheet.

What should I do to minimize taxes?

That is a much larger topic, and one better suited for your own accountant.  Do educate yourself, and find an accountant you can trust.

Final Thought

Numbers are the language of business. Once you have these small business accounting basics down, you’re no longer guessing what to do next—you’re making data‑driven decisions that grow your revenue, trim unnecessary costs, and leave you with profit that fuels the next chapter of your business. Grab the spreadsheet, fill in your own numbers, and start charting your own success story today.

Once you know your numbers, the next step is getting people to your door — read our guide to small business website traffic to learn how.

Ready to access your business insights?
No credit card. No setup fees. Insights in minutes.

Browse Related Articles:

Small Business Accounting made easy
Small Business Accounting Basics: Revenue, Costs & Profit Explained
Don’t let accounting terms scare you. In this post we break down the three most important financial numbers—Revenue, Costs, and Profit—into bite‑size, real‑world examples. By the end, you’ll be able to pull up a spreadsheet, read your numbers, and decide what to do next.
Read More
Small Business Website Traffic
Website & Traffic Basics: Making the Web Work for You
Your website is the front‑door of your business—make it inviting, useful, and data‑driven. This article walks you through the key web metrics, free tools, and simple UX tweaks that turn visitors into customers. No tech background needed – just a willingness to try one new thing a week.
Read More
Email Marketing Metrics
Email Marketing Metrics: Open Rates, CTR, Conversion, and Beyond
Email still rules the marketing world—if you’re not tracking the right numbers, you’re leaving money on the table. This guide breaks down the most important email metrics—Open Rate, Click‑Through Rate, Conversion Rate, and the ones that matter next—so you can measure success, fine‑tune campaigns, and keep your inbox profitable. No jargon, just clear steps and a free spreadsheet you can run today.
Read More
traditional marketing for small business – billboard radio TV and print channels
Traditional Marketing for SMBs – Offline Channels That Drive Traffic & Sales
In a world of pixels and pixels‑per‑inch, the traditional marketing channels—out‑of‑home, radio, television, and local newspapers—still deliver real foot traffic, brand recall, and sales lift for small‑business owners. This guide shows you how to choose the right medium, capture the right data, and lay the foundation for a future multi‑channel comparison so you can combine analog with digital and measure true ROI.
Read More